
dsh-token-usage
监控与用量LaoYueHanNi/dsh-token-usage
一个 DeepSeek Harness 插件,在 Web UI 中显示模型 token 使用情况,包括带成本的摘要卡片、每日趋势图、按模型细分和定价对话框。
- dsh-plugin
验证与兼容性
这里展示目录实际采集到的证据;未声明的信息会明确标为未知。
- 当前版本兼容性
- 已在当前目录版本验证
- 声明的 Harness 范围
- 未声明
- 声明的平台
- 未声明
- 适用 Profile
- web
- 构建授权
- 未知
- 权限声明
- 未声明
- 外部服务
- 未声明
- 遥测声明
- 未知
这不是安全背书;安装前仍应查看源码、权限和配置。
查看证据与判定范围
验证仅覆盖标出的来源、版本和 Harness 环境,不代表未来版本仍然兼容。
github:LaoYueHanNi/dsh-token-usage#84b900da09f52c2250e48fc73b58c57ca3ca4b10- 插件通过清单与静态结构检查,尚未完成运行时加载检查。
README
dsh-token-usage

简体中文 | English
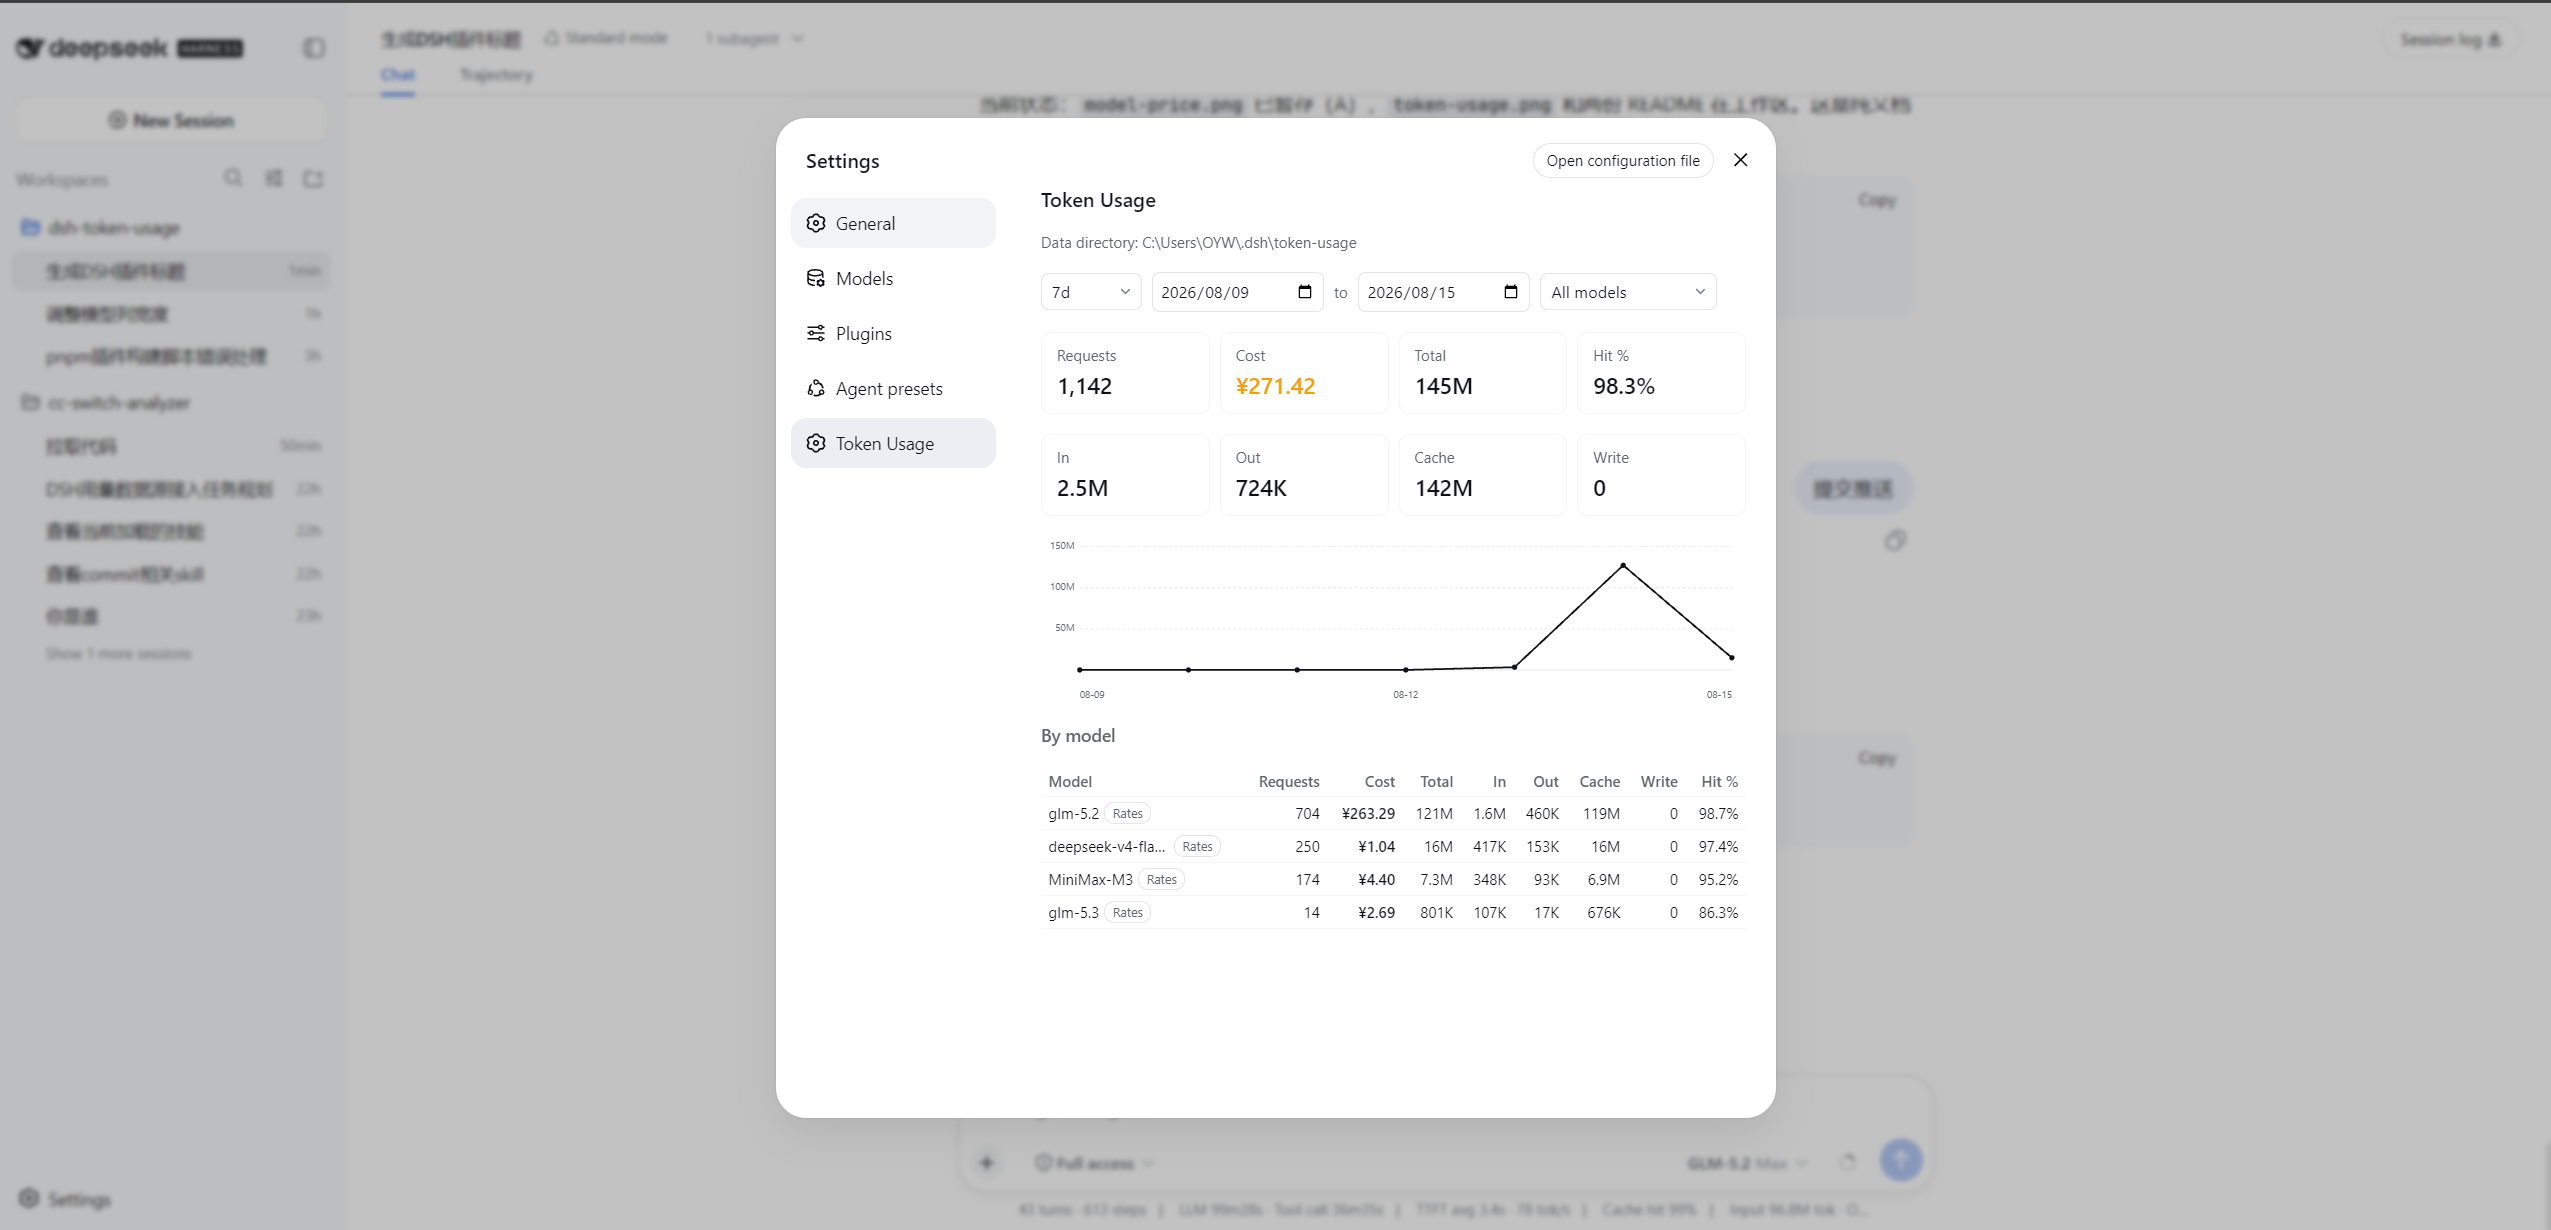
A dsh usage plugin that displays model token usage right in the Web UI. After installation, open Settings (the gear icon in the sidebar) and you'll find the Token Usage page — summary cards (with cost), a daily total-token line chart, a per-model / per-session breakdown, and per-model pricing dialogs, all filterable by date range and model, exactly as shown in the screenshot above.
Repo: https://github.com/LaoYueHanNi/dsh-token-usage
[!IMPORTANT] GitHub direct installs have ended — the repository no longer carries prebuilt output. Install from npm instead:
dsh plugin --profile web add @laoyuehanni/dsh-token-usageUpgrading from a legacy
github:install (≤ 0.3.7, package namedsh-token-usage)? An in-placeupdatefails to load — remove the old name first, then add again. Usage data under$DSH_HOME/token-usage/carries over untouched.
Features
- Live recording: every provider-billed model call is recorded as it happens — tokens, cost, model, session — context-compaction calls included.
- Web stats page: filters (date range + model +
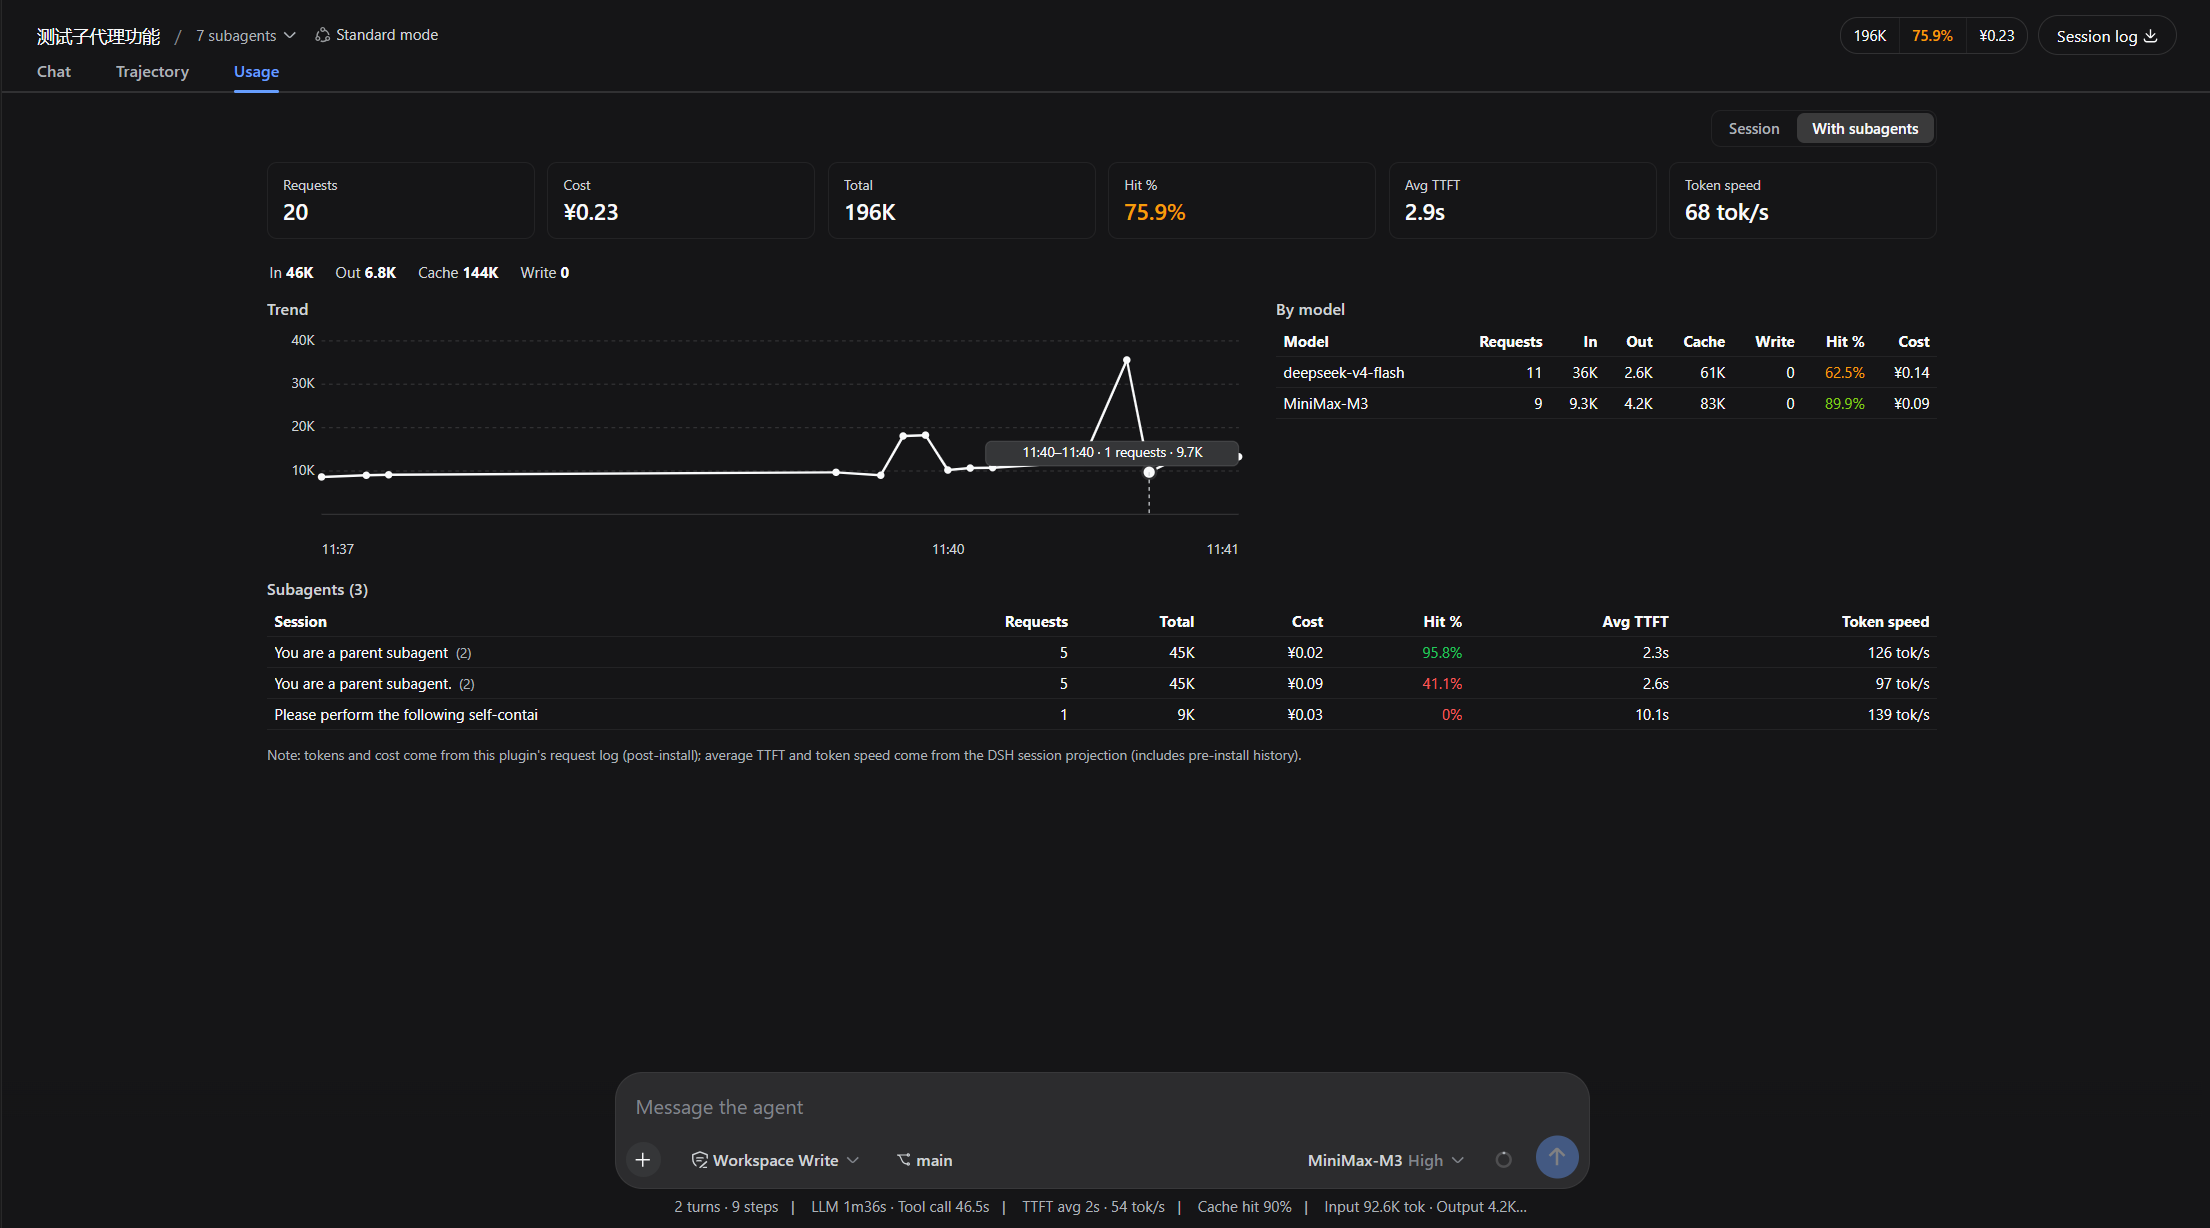
1d/7d/30dshortcuts), summary cards, daily trend chart (hover a day for its total), per-model table. The table block toggles between per-model / per-session: the session table groups by working directory (switchable to a flat list), sorts by total tokens / cost / recent activity on header click, and Ctrl+click on a session row jumps straight to that session's usage tab. - Session usage tab: the conversation pane gains a Usage view tab (beside Chat / Trajectory) with the active session's dashboard — six stat cards (successful requests with a failure pill, cost, cache hit rate, average time-to-first-token, generation throughput, total tokens), a 4-bucket token strip, an hourly trend chart, and a per-model table. A scope switch toggles Session / With subagents, and the subagent table drills into each child and back. Hovering the failure pill breaks failures down per class (rate limited, server error, context exceeded, …).
- Cost figures & model pricing: per-request cost is computed live from per-model rates (¥ per million tokens); unpriced models warn and count as ¥0. Every priced model's name carries a rates button opening its full price table, and the filter row carries a pricing table entry opening an overview of every model in the cloud feed — searchable, with simulated billing and expandable effective rates. Rates sync from the cloud feed on every startup — see Model pricing.
- Provider quota: an input-bar button (left of the model chip) shows the selected provider's remaining quota. See Provider quota.
- History backfill: the first startup syncs requests that happened before installation (idempotent); unreadable session logs are skipped and counted, never fatal to the sync.
Model pricing
Costs are billed per record at its own timestamp. Identification or pricing-rule changes reselect historical rates from raw records on the next read. Models resolve through full original ID matching, provider-prefix ID matching, then upstream aliasPatterns (deprecated aliases are ignored), all ignoring case while preserving versions and model variants. Unknown or ambiguous names have no inferred price. The single source is a cloud mirror auto-synced on every startup — pricing corrections belong upstream in the model-price-table feed, so every user benefits at once. A hand-edited pricing.json is no longer read; if you maintain one it is silently ignored after upgrading (the file is left on disk). Upgrading from 0.4.1 or earlier to 0.4.2 triggers a one-time full rebuild of the usage rollup the first time the stats page is read — the larger the history, the longer it takes; this is expected. An invalid new feed keeps the previous valid mirror. If pricing is unavailable or history cannot be fully repriced, available usage remains visible while unreliable costs are hidden with a reason. Missing entries in a valid feed are warned separately. Unpriced names offer local search, full rule preview and explicit association to an existing cloud model ID. Folded rows retain original sources; Manage model associations also lists inactive or unused choices and supports revocation. Associations preserve upstream billing rules and reprice history. An upstream Issue entry opens a draft for you to complete; it never submits automatically. Default location: ~/.dsh/token-usage/. Billing rule chain, cloud feed format, and self-hosted mirror URLs: docs/pricing.md.
Configuration
Data directory
Editable on the web card (Settings → Plugins → Token Usage): saving an absolute path takes effect immediately — history migrates automatically, no restart, no manual move. Blank keeps the default ~/.dsh/token-usage/. A save is refused while a conversation is in progress; wait for it to end, then save again. Or set it directly:
plugins:
  token-usage:
    path: D:/data/token-usage   # default: ~/.dsh/token-usage/
Pricing region
The pricing mirror follows your region: Gitee by default (fast inside mainland China) or the GitHub mirror of the same table — pick once on the web card's Pricing region dropdown or via config. The pick also drives the display currency (¥ RMB vs $ USD at the table's exchange rate).
plugins:
  token-usage:
    pricingRegion: overseas   # default: domestic
Provider quota
The input-bar button follows the currently selected provider and opens a panel with remaining quota (the same API key as inference):
| Provider | Shows |
|---|---|
| Zhipu GLM Coding Plan (CN / international) | 5-hour, weekly (some plans also monthly) |
| Kimi For Coding | 5-hour, weekly |
| MiniMax Coding Plan (CN / international) | 5-hour, weekly |
| OpenCode Go | 5-hour, weekly, monthly |
| DeepSeek (official) | ¥ account balance |
| OpenRouter | $ remaining credits |
Unsupported providers hide the button; a failed query can be retried from the panel. On by default; turn it off with quota.enabled: false. Not supported yet: Volcengine, ZenMux, Zhipu Team plan, Claude / Codex / Gemini / Grok official subscriptions, GitHub Copilot.
Install
dsh plugin --profile web add @laoyuehanni/dsh-token-usage
The package declares
dsh.bundle, soaddwires the plugin into the profile automatically — installs work out of the box, and the first startup backfills pre-install history.
Update
dsh plugin --profile web update @laoyuehanni/dsh-token-usage
Remove
dsh plugin --profile web remove @laoyuehanni/dsh-token-usage
Data files under $DSH_HOME/token-usage/ are kept — delete them manually if you no longer need them.
Development
Build once, install a symlink, iterate:
pnpm install
pnpm build:all
pnpm test                # vitest
dsh plugin --profile web add link:D:/plugins/dsh-token-usage
Rebuild and restart dsh web to apply changes (pnpm watch:client in the plugin directory hot-reloads the client). No prepare script by design — lib/ never enters the repo; pnpm publish builds it fresh into the tarball.
Temporary host-only mount (this launch only, no profile changes): copy cordis.example.yml to cordis.yml, point name at the absolute file:// URL of your lib/index.js, then dsh web --patch <plugin-dir>/cordis.yml. Data recording works in this mode; for UI work use the link: install above.


